- Table of Contents
- 1. Introduction
- 2. The Wii Remote
- 3. Online Software
- 4. Offline Software
- 5. Future Work
- 5.1. Wii Motion Plus
- 5.2. Sensor Bar
- 5.3. Alternatives
- 6. Conclusion
1. Introduction
Some months ago (Keeping Track, Issue 6) Mike Fisher raised the question of how we might make some sort of track-monitoring device for the WHR. Whilst reports from train crew and track walkers will help to identify departures from ideal track profile, being able to quantify this conveniently will allow:
To monitor track profile over time, so that action can be taken when necessary
To compare different sections of track so that work can be prioritized
Track parameters can of course be measured manually at site, but a train-mounted system would provide an easy way to make a regular measurement of the whole railway.
Having recently read about re-purposing of the Nintendo Wii Remote it struck me that this might just answer, as it's cheap and has a 3-axis accelerometer.
2. The Wii Remote
The Nintendo Wii is a games console. The main accessory with which users interact with a game or other application running on the Wii is the Wii Remote or “Wiimote”. Features of note include:
Connection between Wii and Wiimote is wireless
Wiimote includes a 3-axis accelerometer
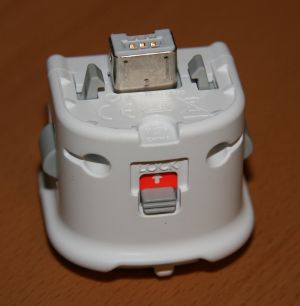
The accelerometer in the Wiimote is used typically to measure pitch and roll angles as the device is rotated by the user, using the downwards force of gravity, or more generally for any acceleration in 3 axes, e.g. for making a game character jump. Axis definitions are given in Figure 1. Note that the accelerometer cannot measure yaw (rotation about the vertical axis), because there is no change in the gravity vector. This is why a “sensor bar” is used, although in fact it is no such thing. It contains infra-red LEDs, which are seen by the camera at the front of the Wiimote. We will not initially be using the sensor bar for this application.

The accelerometer is an ADXL330 by Analog Devices. The measurement range is up to 3 g. This is beyond our requirements — the passengers would complain! Power is supplied by 2 AA batteries, which should last about a day. Unfortunately the readout of the accelerometers is only 8-bit, and the resolution is about 0.4 m.s-2. The translates to a resolution in rotation of 2.3°.
The wireless communication link is fortunately standard Bluetooth. This means that no special hardware is required, just a common Bluetooth dongle, if it is not built into the computer already. In fact the computer I have chosen does include a Bluetooth adaptor.
3. Online Software
 | By “online” I mean software for live data collection, as opposed to the offline software for analysis of the collected data. |
Of course Nintendo are mostly interested in selling Wiis, not helping amateur developers. Fortunately again other people have already done the hard work, and there are several libraries available for communicating with the Wiimote. These in turn have been used by several end-user applications for various purposes.
The computer I chose is the Nokia N810. This is a full-function Linux-based computer, but pocket sized. As mentioned, Bluetooth is included, as is a GPS receiver. Note however that an ARM-based processor is used, rather than an x86 type typical of desktop machines. This adds some slight complication to software compilation. However, this is side-stepped by using Python, an interpreted language.
I found a Python program, Py Axel Wii, which plots acceleration data read from the Wiimote. I performed several modifications, most notably:
Enable logging, with 1-second averaging
Add position and velocity data from the GPS receiver
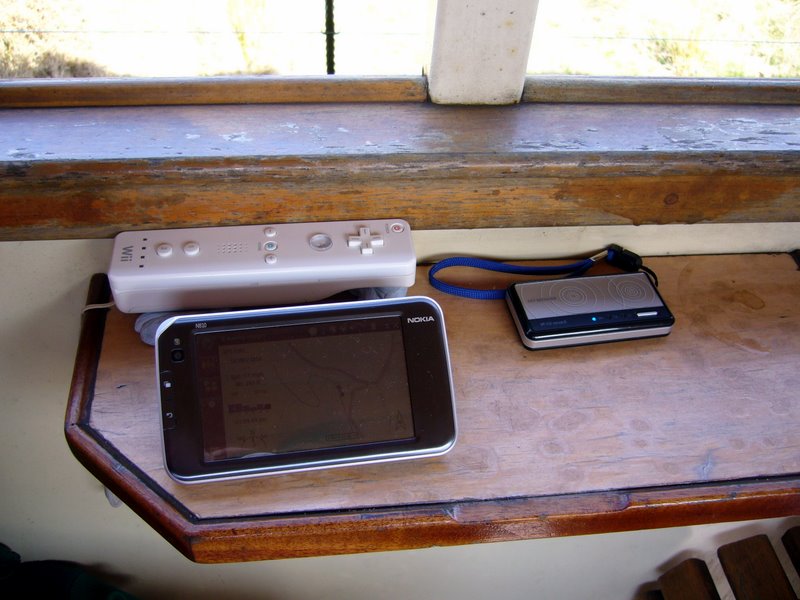
For my initial tests I have used an external GPS receiver, as it achieves a fix more quickly than the internal unit. Also, if the Wiimote is mounted remotely from the computer the GPS can be co-mounted, to avoid any extra location error. Figure 2 shows my test set-up.
My first test run was from Rhyd Ddu to Beddgelert. Up was by the Ashbury coach, and down by a semi-open coach. Raw data are plotted below (using gnuplot).
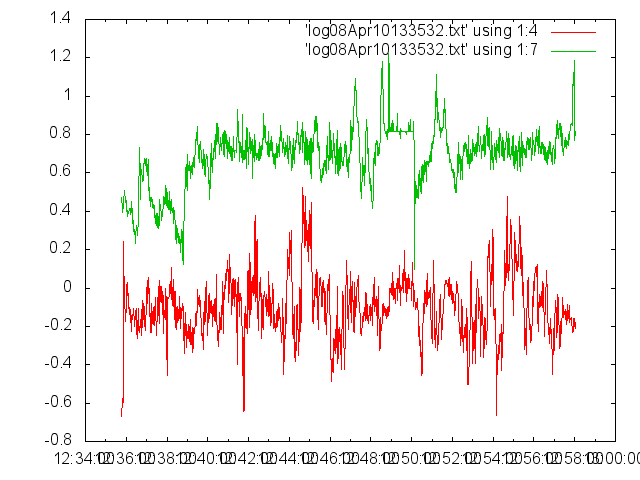
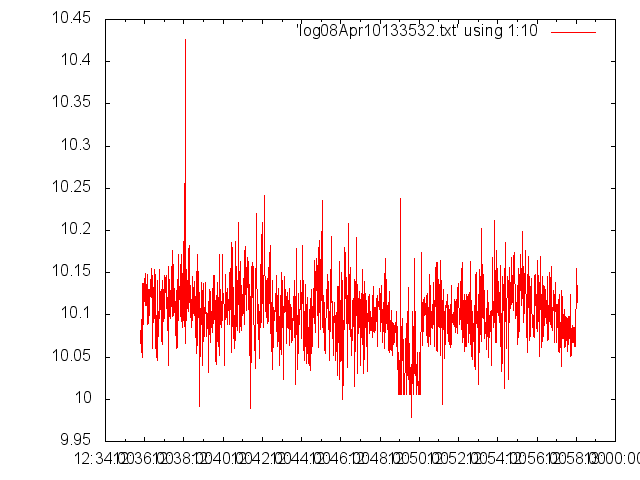
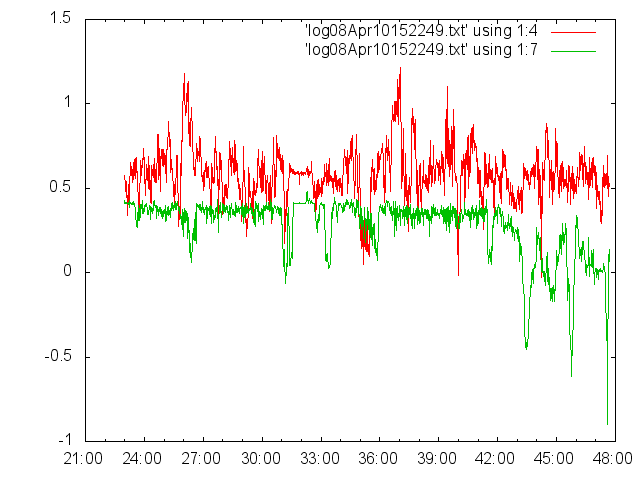
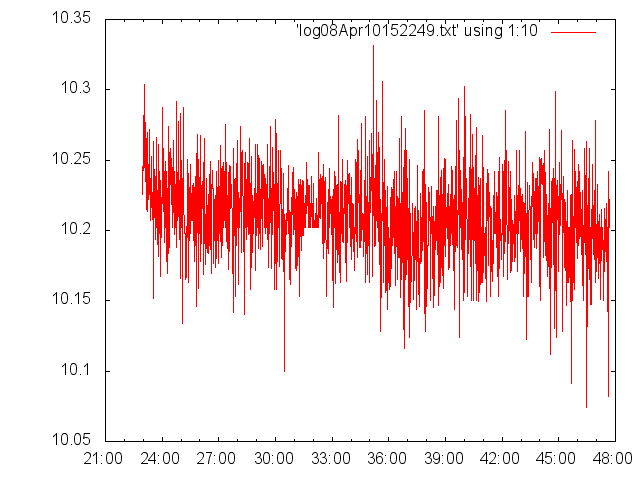
The units are nominally m.s-2. But despite using the Wiimote's internal calibration the z readings are clearly high (g is 9.81 m.s-2).
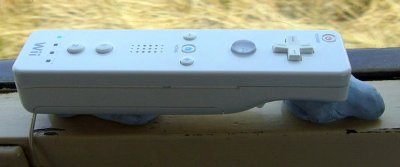
The mean x and y accelerations should be zero. That they are not is down to misalignment of the Wiimote — it wasn't level. I have since increased the displayed resolution to ease setup. For these tests I held the Wiimote in place with Blu-Tak.
The most evident features in the y plots are break applications. These are positive in the Up direction and negative Down. The Wiimote was facing Ffestiniog in each case, hence the change of sign.
Our stop of Meillionen is evident in each plot. The snatch of the couplings can been seen as a large (negative — i.e. towards Ffestiniog) acceleration in the first plot.
Interpretation of the x data is less straightforward. Several of the more evident features are located on the sharp bends (most notably the lower S, especially coming down the hill).
The z data are largely uninteresting. There was an apparent drop in gravity when the Ashbury coach stopped at Meillionen. There is an associated change of the y level, so this might be a change in pitch as the couplings are relaxed.
4. Offline Software
Collecting the data is only half the task. Presenting the data coherently is equally challenging. As seen above there can be artifacts from sensor misalignment. These can be removed by filtering or by a coordinate transformation (rotating the data in software as if we had it correctly aligned). Of course it would be best to get the alignment spot on in the first place.
Plotting the data against time is not ideal. It is better to plot data on a map or against chainage.
4.1. Data Plotted on a Map
I wrote a program in Java to read logs written on the Nokia. This optionally high-pass-filters accelerometer data (by convolution with a Gaussian and subtracting). Data are written to a kml file. This is a format read by the Google Earth application.
The selected acceleration data (x, y or z) are drawn as a LineString at a height above the land surface depending on the magnitude of the acceleration. The maximum acceleration is scaled to 100m. The area below the line is coloured green or red if the acceleration is positive or negative respectively. The kml file is then loaded into Google Earth. The route is best viewed at an oblique angle — control-drag the mouse to change your viewing angle. Figure 7 shows x data around the Weirglodd Isaf curves, with no filtering.
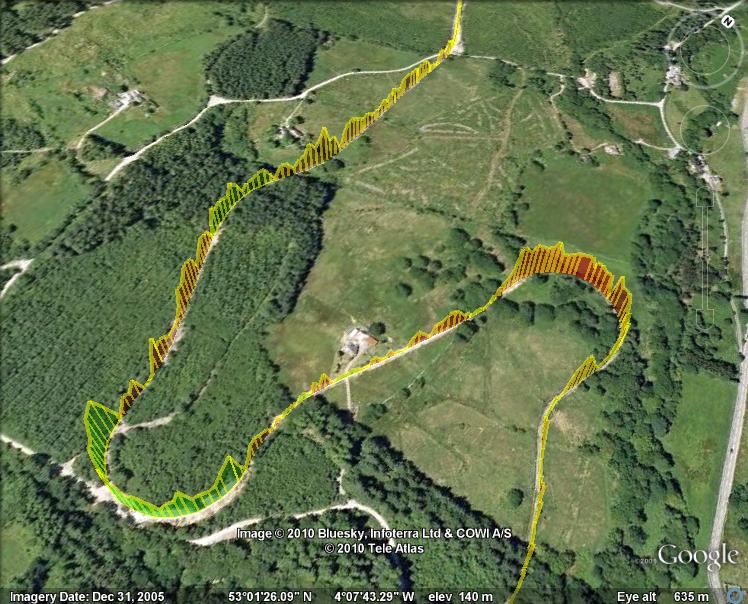
Let us look at the trace around Canal Curve (this was travelling south, so we are going anti-clockwise around the bend and positive x is towards the centre of curvature). As the train rounds the bend there are two competing effects:
The cant of the track tilts the sensor down to the left — this introduces a negative x value
The train accelerates towards the centre of the curve (the “centripetal” force) — this introduces a positive x value
Slow changes in acceleration are not so interesting. We want to look for sudden spikes, due to kinked joints for example. To make these more obvious we can filter out lower frequencies in the data stream. Figure 8 shows high-pass-filtered x data. The steady accelerations around the bends have been removed, leaving a more noise-like signal. Any large spikes here could be worth investigating, but it doesn't look bad — of course!

4.2. Data Plotted Versus Chainage
The data presented above are 2-dimensional. In a sense the railway is 1-dimensional, so we could simply plot the data versus the distance along the line — the chainage. This would then enable data from different runs to be overlaid, performing statistical tests such as a “jack-knife”, so that real effects can be distinguished from sensor noise. There are however some difficulties in doing this, principally the noise on GPS location. We also need a table of GPS coordinates for chainage values. This should be available from the construction survey, or we can visit each chainage marker and log GPS coordinates.
5. Future Work
5.1. Wii Motion Plus
It is apparent that the wiimote is indeed producing sensible data. It is not yet clear if the signal-to-noise ratio is good enough for the desired sensitivity. However, the test run was conducted from the saloon of two coaches in a service train, i.e. above the coach suspension. Clearly we can expect accelerations to be greater on the unsprung side of the suspension. Also measuring directly from a bogey would better localize data to a point on the track.
One problem with the accelerometer data is that it is not possible to distinguish unambiguously linear accelerations from changes in tilt. This is also a problem for games, so Nintendo have introduced an add-on product — the Wii Motion Plus. This comprises a 3-axis angular rate sensor, reading rotation rates in degrees per second. This could prove very useful. For example, moving from a straight into a curve we should observe zero angular rate, then an increase through the transition, and a constant rate through the curve itself. Any departure from this could be flagged. Kinked joints should present a spike in angular rate.
However, the Python library used by Pyaxelwii was written before the new device became available, so some work is needed to add this facility. I have the hardware (subject to extracting from its intended use!) and hope to pursue this.
5.2. Sensor Bar
As mentioned previously the “Sensor Bar”, comprising infra-red light sources, provides a means of measuring yaw. Should we mount a wiimote on a carriage bogey it could be worth also mounting the equivalent of a sensor bar opposite it at the second bogey (but note that it would require and unobstructed view). The resulting yaw values would be a direct measurement of bogey rotation about the vertical axis, which in turn provides a measure of track curvature (the equivalent of a versine measurement).
5.3. Alternatives
If it is determined that higher sensitivity is required this is possible with off-the-shelf hardware made for radio control and robot hobbyists (e.g. CH Robotics or SparkFun). Whilst more expensive than Wii controllers these are still much cheaper than commercial solutions.
6. Conclusion
Initial tests from the saloon of service train coaches has demonstrated that the wiimote should be just sensitive enough to be useful. Further development of software and hardware will improve its utility. Following a little more development it would be interesting to try the system on a stretch of track with a known problem to see if it can detect it.